Key highlights
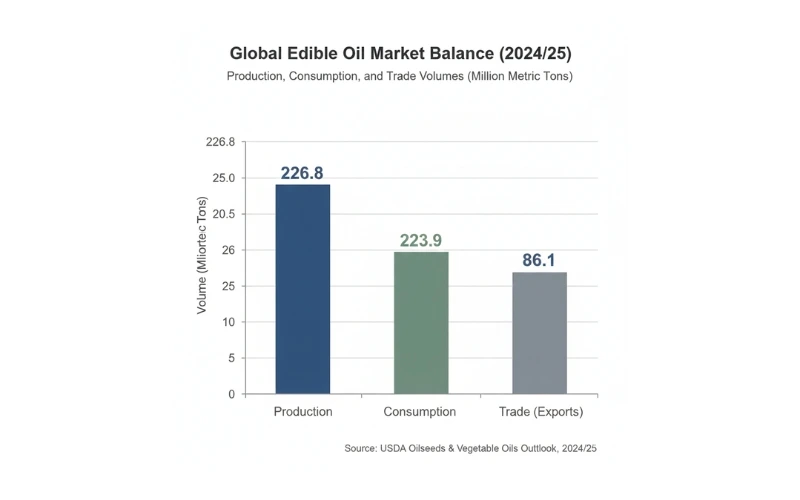
- The global edible oil market isn't short on supply, but it's far from comfortable. With production around 226.8 MMT and consumption close behind at 223.9 MMT, there's not much room for surprises.
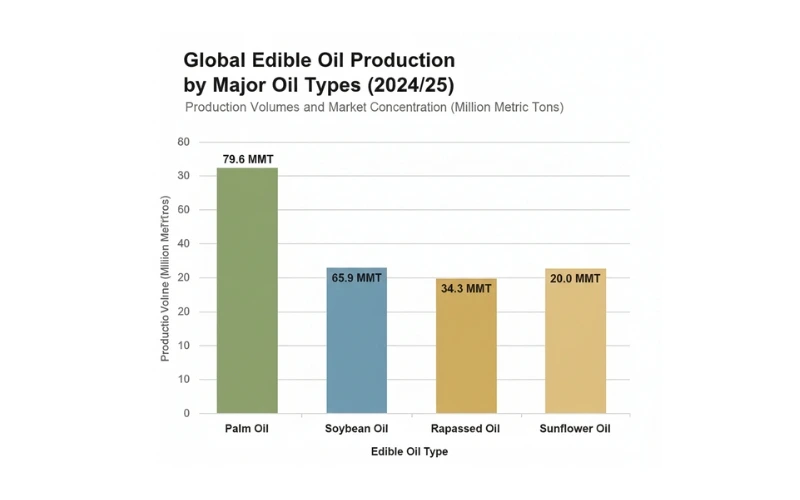
- Palm oil and soybean oil continue to carry the market, together accounting for over 64% of global production. Which is why weather swings or policy moves in key producing regions never stay local.
- India remains the biggest demand driver, importing about 15.2 MMT — nearly a fifth of global edible oil imports. When India adjusts duties or preferences, exporters feel it almost immediately.
- Indonesia and Malaysia still dominate exports, but the landscape is widening. Argentina, Russia, Ukraine, Canada, and the U.S. are quietly gaining ground through soybean, sunflower, and rapeseed oils.
- Palm oil exports have softened as more supply gets absorbed into biodiesel at home. Soybean oil, especially from the Americas, is increasingly filling those gaps.
- Ending stocks near 27.9 MMT leaves little buffer. That's why prices react quickly — even small disruptions tend to move the needle.
The Big Picture Behind Today's Edible Oil Trade Flows
The global edible oils market doesn't usually make noise. It moves in increments, reacts to weather, policy, and consumption habits, and then suddenly, when you step back, you realise the ground has shifted. That's where we are right now.
Based on USDA assessments for the 2024/25 season, global vegetable oil production stands at roughly 226.8 million metric tons, while consumption is close behind at 223.9 million metric tons. Trade volumes hover around 86.1 million metric tons, which tells you one thing clearly: this is not an oversupplied market. It's tight, balanced, and increasingly sensitive to small disruptions.
For edible oils exporters, importers and wholesalers, this isn't background information. This is the playing field.
Production is Concentrated and that Concentration Carries Risk
Global edible oil production isn't spread evenly across the map. It's clustered — and heavily so.
Indonesia leads with about 52.8 MMT, followed by China at 30.8 MMT, Malaysia at 21.6 MMT, the European Union at 18.3 MMT, and the United States at 14.3 MMT. Add Brazil at 12.5 MMT, and a pattern becomes obvious.
When production is this concentrated, policy changes, export restrictions, or weather shocks in just one region don't stay local for long. They ripple through global agriculture trade. Anyone looking to buy bulk edible oils or import bulk edible oil learns this lesson quickly.
What Oils Actually Run the Market
Palm oil and soybean oil still do most of the heavy lifting. Palm oil production is estimated at around 79.6 MMT, soybean oil at 65.9 MMT. Together, they account for more than 64% of global edible oil output.
Sunflower oil, at roughly 20.0 MMT, and rapeseed oil, near 34.3 MMT, play smaller but strategically important roles — especially in regions where taste, labeling, or political considerations influence sourcing decisions.
For edible oils suppliers, this mix matters. Buyers don't just ask "what's cheapest?" anymore. They ask what's available, what's reliable, and what won't trigger consumer pushback six months down the line.
Imports: Why India Quietly Sets the Tone
India alone accounts for close to 19% of global edible oil imports. That number tends to sneak up on people. But once you sit with it for a moment, a lot starts to click.
When Indian consumption patterns shift, when duties are adjusted, or when substitution between oils picks up, global edible oils export markets feel it almost immediately. China follows with about 9.9 MMT, the EU at 8.7 MMT, and the United States at 7.2 MMT.
Big buyers don't merely show up in markets. Over time, they quietly bend them.
Exporters: Palm Still Leads, but the Ground Is Shifting
Palm oil exporters, particularly Indonesia and Malaysia, continue to anchor global supply. Indonesia alone exports roughly 26.5 MMT, with Malaysia contributing another 17.2 MMT. That dominance hasn't disappeared.
But the export landscape isn't frozen anymore. Argentina, Russia, Ukraine, Canada, and the United States are becoming more visible through soybean, sunflower, and rapeseed oil exports. The result is a more competitive environment for edible oils exporters - and more sourcing flexibility for edible oils importers who prefer not to depend on a single origin.Is that a bad thing? For buyers, probably not.
-blog-chart-2.webp)
Palm Oil vs Soybean Oil: A Quiet but Important Turn
Palm oil exports have declined by around 1.4 MMT, largely because more supply is being absorbed domestically for biodiesel use in Indonesia and Malaysia. At the same time, soybean oil exports from the United States, Argentina, and Brazil have been stepping in.
It's not a dramatic switch. More like a slow rebalancing. Over time, soybean oil is increasingly acting as a substitute when palm oil availability tightens, not loudly, just consistently.
Prices, Stocks, and Why Volatility Isn't Going Away
One unusual feature of the current market is palm oil trading at a premium to soybean oil — historically rare. That alone tells you availability is tight.
Global ending stocks for vegetable oils are estimated at around 27.9 MMT, lower than previous years. A tighter stock-to-use ratio means prices react faster to news, whether it's weather, geopolitics, or policy tweaks.
For edible oils wholesalers and bulk buyers, this makes timing and diversification more important than ever.
Consumption Isn't Slowing — It's Broadening
Demand growth isn't coming from one place. It's spread across food consumption in India, China, Southeast Asia, and Africa, alongside rising industrial and biodiesel usage for palm and soybean oils.
Oilseed crushing is also rising, tied closely to animal feed demand. This keeps the entire ecosystem linked — food, fuel, and feed moving together rather than in isolation.
Trade Reality Check: HS Codes That Matter
For credibility in global food trade, the basics still matter:
- Soybean oil: HS 1507
- Palm oil: HS 1511
- Sunflower oil: HS 1512
- Rapeseed oil: HS 1514
Paperwork doesn't move markets, but mistakes here can stall shipments faster than any price dispute.
Reading the Market, Not Just the Numbers
The forecasted growth visuals circulating in the industry, including long-term market size projections, should be read as indicative, not definitive. They reflect assumptions, sample modeling, and trend extrapolation, not guarantees. USDA data tells us where the market is today. Projections suggest where it could head if current forces stay in play.
For businesses looking to buy bulk edible oils or expand sourcing, the smarter move is to read both together, present fundamentals and forward-looking signals, without confusing one for the other.
Final Thought
The global edible oils market isn't just about volume anymore. It's about optionality, reliability, and understanding who really shapes demand. For edible oils importers, suppliers, and wholesalers, the winners won't be the loudest players — they'll be the ones who read the undercurrents early and adjust before the rest of the market catches on.


-distributorship-process-investment--margin.webp "Fortune Oil (Adani Wilmar) Distributorship: Process, Investment & Margin")

")