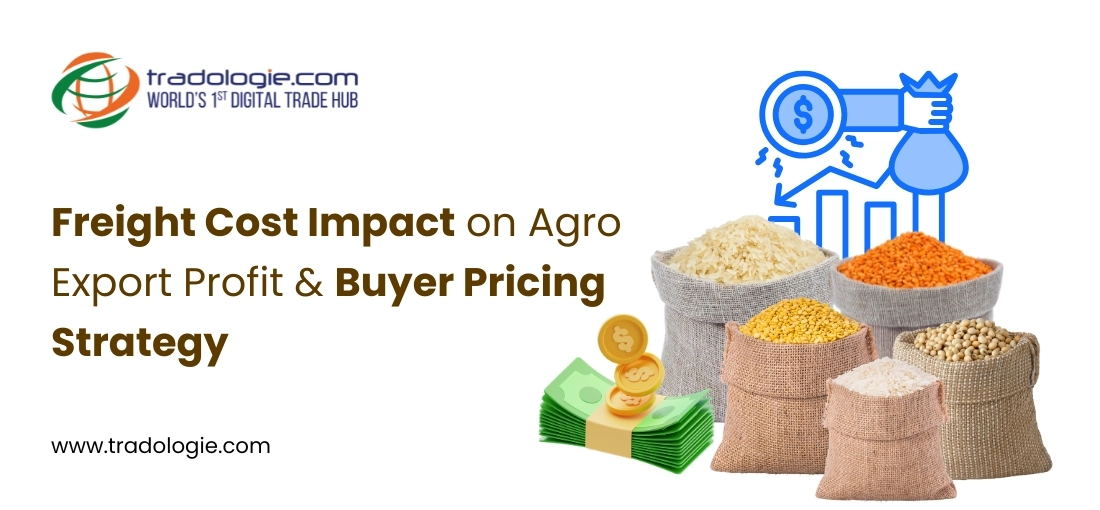
Key Highlights
- Freight costs extend far beyond the base ocean freight quote.
- Fuel surcharges, currency fluctuations, and port charges can significantly impact margins.
- FOB, CFR, and CIF contracts carry different freight risk levels.
- Rising freight costs can affect insurance premiums and export profitability.
- Container utilization plays a major role in reducing logistics expenses.
- Strong freight planning helps exporters remain competitive in global markets.
Introduction:
Are you a new exporter looking to know how to calculate the freight cost in agro exports ? Sit down with any newcomer to the trading sector, and they will eagerly show you their preliminary margin sheet. It's always an immaculate piece of work. On paper, the math holds up beautifully: you purchase a few containers to export rice in bulk , export spices in bulk, export sugar , or export dried fruits in bulk from a regional hub, add the ocean freight quote dropped on your desk by a forwarder, factor in basic custom house agent fees, and look forward to a comfortable, predictable margin.
But, If you want to protect your capital, you have to look past the surface-level logistics data. The difference between a highly profitable enterprise and a sudden financial loss rarely comes down to your baseline product sourcing price. It is determined entirely by your command over the volatile, unquoted variables that make up the true Impact of Freight Costs on Exports— pressures that pull liquidity out of your accounts when your cargo is already out on the water.

The Anatomy of Export Freight Cost Calculation
When a shipping line issues a quote for moving bulk agri-commodities, that figure is highly deceptive. To find the true Freight Cost for Exporters , your financial desk must run a multi-tier calculation that accounts for variable surcharges and local terminal expenses.
The baseline formula for your landed logistics cost per container is structured as:
Total Shipping Cost = Base Ocean Freight + BAF + CAF + PSS + Origin THC + Destination THC
To see how these variables interact under real-world pressure, examine this itemized matrix tracking a standard 20-foot Heavy Tested Freight Container moving agri-commodities:
| Component / Surcharge Type | Mathematical Application & Formula | Financial Impact on a $30,000 Cargo Value | Operational Risk Behavior & Surcharge Trigger |
|---|---|---|---|
| Base Ocean Freight | Flat rate per container slot. | $2,500 (Baseline) | Sets the core benchmark for standard port-to-port maritime transit based on general lane demand. |
| Bunker Adjustment Factor (BAF) | Percentage of Base or Flat Rate per Ton. | $450 (At 18% fuel variance adjustment) | Adjusts rapidly based on global marine crude oil indices; completely driven by fluctuating energy grids. |
| Currency Adjustment Factor (CAF) | Multiplier applied to Base Freight (Base x Δ%). | $125 (Based on a 5% currency swing against USD) | Fluctuates daily; can erase margins if your bank conversion timing lags behind the bill of lading date. |
| Peak Season Surcharge (PSS) | Flat seasonal addition per container box. | $600 (Triggered during regional harvest gluts) | Spikes aggressively during major crop harvests when container demand outstrips regional port supply. |
| Terminal Handling Charges (THC) | Fixed local port authority tariff. | $350 (Origin port crane and yard handling) | Stationary but must be paid upfront before custom house agents can file a shipping bill. |
| True Operational Freight Cost | Sum of all variables above. | $4,025 (An effective 61% spike over base quote) | The real number that must be utilized inside your Agro Export Pricing Strategy. |
Designing a Bulletproof Agro Export Pricing Strategy
To prevent sudden maritime freight shocks from completely erasing your corporate liquidity, your finance desk cannot rely on lazy, fixed-price guessing. You must align your pricing models with specific international commercial terms (Incoterms) that clearly define where your financial liability ends.
Rather than relying on prose-heavy summaries that look robotic, the table below maps out the tactical application of the three dominant pricing strategies used by professional trade desks to balance freight risks against buyer expectations:
Strategic Evaluation of Export Pricing Models
| Pricing Framework | Practical Application in Agri-Trade | Ultimate Impact on Corporate Margins | The Buyer's Selection Perspective |
|---|---|---|---|
| FOB Sourcing (Free On Board) | The exporter bears all costs until the cargo clears the ship's rail at the domestic exit port. | Low Risk / High Stability: Completely insulates your trading floor from sudden changes in international ocean freight rates. | Highly preferred by large-scale global buying houses who maintain their own massive, low-cost shipping line contracts. |
| CIF Delivery (Cost, Insurance & Freight) | The exporter pays for all freight, surcharges, and maritime insurance up to the buyer's target port. | High Risk / High Margin Potential: Exposes your desk to sudden carrier surcharges while your containers are in transit. | Preferred by mid-tier regional importers who lack the logistics infrastructure to manage international ocean freight lines independently. |
| CFR Configuration (Cost and Freight) | Similar to CIF, but the buyer takes on the responsibility of arranging and paying for their own marine cargo insurance. | Balanced Risk Matrix: The exporter controls the ocean shipping leg but avoids the legal liabilities of cross-border insurance claims. | Ideal for buyers operating in destination countries with strict local marine insurance procurement laws. |
(The figures are indicative and for the purpose information and education)
The Cascading Impact of Freight Costs on Exports
A common mistake made by automated trading desks is assuming that a $1,500 jump in ocean freight simply means $1,500 less profit. In the agricultural sector, freight is a compounding variable. It fundamentally alters your tax drawbacks, your insurance premiums, and your financing costs.
The Insurance Premium Multiplier
When you shift from an FOB strategy to a CIF arrangement to satisfy premium Global Rice Buyers or Global Spice Buyers, your marine insurance cargo premium is not calculated on the raw product value alone. It uses the standard international valuation formula:
Insured Value = (FOB Value of Cargo + True Ocean Freight Cost) * 1.10
If your Agricultural Export Shipping Costs surge due to a sudden peak season surcharge, your insured value inflates automatically. Consequently, your insurance underwriter pulls a higher premium out of your escrow account, creating a secondary cash leak from a primary freight shock.
The Export Incentive Drag (RoDTEP & DBK)
India offers excellent export incentive schemes like RoDTEP (Remission of Duties and Taxes on Exported Products) and Duty Drawback (DBK) to keep subcontinental traders competitive. However, the government calculates these incentive percentages strictly on the FOB (Free on Board) value of the goods, never on the CIF value.
To execute clean Export Cost Management , your sales desk must explicitly separate the product value from the maritime freight charges on the face of the commercial invoice. This ensures customs computers assess your tax incentives on your true processing value, rather than penalizing your incentives because shipping lines raised their bunker fuel surcharges.
Volumetric vs. Deadweight Cost Impact
Agricultural products force logistics managers to balance two completely different physical realities: space and weight. Ocean carriers charge you based on whichever limit your container hits first.
- The Weight Limit (Heavy Cargo): Commodities like sugar and non-basmati rice hit the physical payload capacity of a container long before the box is visually full. A standard 20ft container maxes out at roughly 26 metric tons.
- The Volume Limit (Light/Bulky Cargo): Commodities like dried fruits, seed spices, and whole chillies fill the entire physical space of the container long before hitting the legal weight limit.
This layout means your pricing strategy must adjust its math based on the specific commodity class. If your warehouse teams pack dried fruits or spices loosely, leaving empty pockets inside the master cartons, you are essentially paying premium container rates to transport trapped air across the ocean. The shipping line will assess a volumetric weight penalty, driving up your per-kilo freight cost and destroying your ability to bid competitively against highly optimized global trading houses.

Defensive Logistics Strategies for Trade Desks
Because international custom regimes and shipping lanes operate as an unforgiving, transactional dragnet, successful trading companies don't just focus on the basic freight quote; they aggressively protect their financial capital from terminal variables.
First, protect your transaction margins from expensive terminal penalties by locking in extended free-time allowances directly inside your ocean shipping contracts. Never accept the baseline three-day gate cushion offered by standard carrier booking systems. Insist on a minimum 14-day factory-to-dock free-time clause listed explicitly on your ocean bills of lading. If a destination custom house flags your container for a random manual audit or an administrative document review, this contract clause protects your capital, ensuring the processing delay won't trigger immediate, daily demurrage and equipment detention charges that bleed your liquidity dry.
Second, ensure absolute data matching across your entire shipping manifest before closing a deal on any digital interface. Your document control team must manually cross-verify every single line item on the commercial invoice against the packing lists, weight slips, and transport bills before the vessel departs the harbor. Modern customs portals use strict, automated character-matching filters; an inverted address syllable or a minor digit variation on a weight certificate will immediately flag the container as a compliance risk. Eliminating these preventable clerical mismatches keeps your cargo rolling through digital green lanes, saving your operational capital from getting swallowed by avoidable port storage penalties.
Summary
The era of the legacy commodity broker who relies on vague freight estimates and loose local handshakes is drawing to a close. The future of the international agricultural arena belongs to data-literate trade desks that treat precise freight calculations, Agro Export Pricing Strategy balancing, and structural risk management as absolute corporate priorities. By professionalizing your administrative workflows, using precise mathematical pricing strategies, and maintaining an error-free paper trail, you protect your trading floor from market volatility and transform shifting global logistics into a secure, predictable, maximum-profit enterprise.





.webp "Export Saffron/Kesar from India Certification, Packaging and Buyer Markets 2026")