Key Highlights
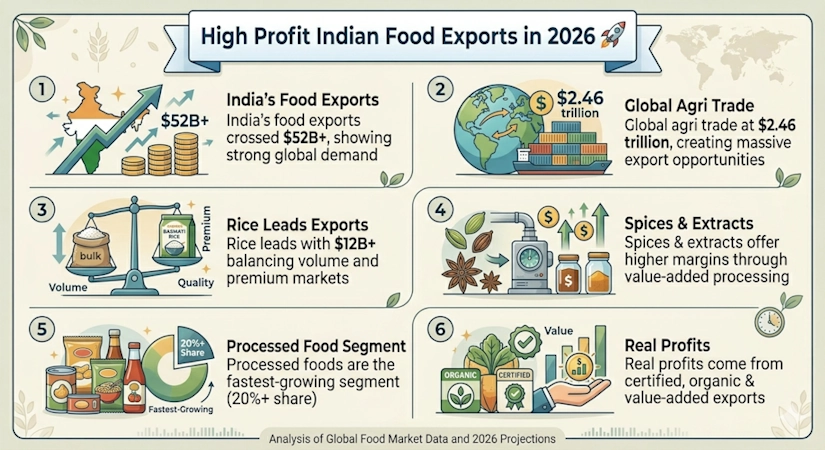
- India agro exports reached $52.26B , showing strong global demand.
- Global agriculture trade valued at $2.46 trillion (massive opportunity).
- Rice leads exports: $6.53B (Non-Basmati) + $5.94B (Basmati) .
- Spices exports crossed $4.72B with high margin potential.
- Processed foods now contribute 20%+ share (fastest growing segment).
- Organic exports offer 15-25% premium margins.
- Buffalo meat exports reached $4.06B (strong global demand).
- Highest profits come from value-added, processed, and certified products
Introduction:
The 2026 global food trade landscape presents a staggering commercial frontier, with the Global Agriculture Trade Size now valued at US$ 2.46 Trillion. Within this high-velocity arena, India has solidified its position as a Tier-1 supplier, commanding a US$ 52.26 Billion export valuation. Currently ranked as the 9th largest exporter in the world with a 2.20% global market share , India provides the critical caloric infrastructure for over 150 nations.
(Source: APEDA Annual Report 2024-25 | WTO).
However, for the sophisticated trader, success isn't found in mere participation; it is found in identifying the specific high profit Indian food products for export that offer the most aggressive ROI. While India's credibility is anchored in its massive production of staples, the real commercial leverage has shifted toward technical, value-added segments that bypass the razor-thin margins of raw commodities. This briefing moves past generic volume metrics to spotlight the elite products that are currently defining India's most profitable trade corridors.
The Commercial Drivers of Profitability
Profitability in profitable Indian food exports isn't coming from doing the same things better; it's coming from a deliberate, top-down realignment of the supply chain. According to data from PIB Press Releases and the APEDA Annual Report 2024-25, the valuation of India's agri-exports has maintained a steep upward trajectory, climbing from USD 34.5 billion to USD 51.1 billion. An 8.2% CAGR is rarely a fluke. It signals India’s pivot into a high-spec supplier capable of hitting the technical benchmarks required by the world's most demanding trade corridors.
The real engine here is a massive shift toward value-addition. According to the APEDA Annual Report 2024-25, the export share of processed foods jumped from 14.9% to 20.4%. That is where the margin lives. By moving away from the "buy low, sell high" volatility of raw bulk commodities and focusing on high-velocity, shelf-stable ingredients, exporters are successfully insulating their bottom line from the chaos of spot-market fluctuations.
Global demand is now a game of industrial consistency and the "clean audit trail." According to the APEDA Annual Report 2024-25, India’s diverse production zones and modernized infrastructure are finally allowing it to function as a reliable source for high-spec, long-term contracts. For the trader in 2026, the strategy is clear: chasing volume is a race to the bottom, but capturing technical premiums in value-added corridors is where the real yield is found.

The Core Portfolio: Identifying the Best Food Products to Export from India
Selecting the best food products to export from India requires a shift in perspective. It isn't just about what India grows in abundance; it's about identifying where the global supply-demand gap is widest and where technical specifications allow for price control. In the 2026 trade cycle, the "low-hanging fruit" has disappeared. The real yield now lives in segments that demand high-spec consistency and logistical precision.
3.1 Rice: The Anchor of Global Food Security
India's dominance in the global rice market is a structural reality that competitors have struggled to disrupt. India currently manages a dual-track rice economy that caters to both high-velocity volume corridors and elite, premium dining segments.
Non-Basmati Rice: The Volume Engine Generating a massive USD 6.53 Billion in export value, non-basmati rice functions as the "caloric insurance" for much of the developing world. The strategy here is scale. According to trade data, the profitability in this segment is driven by logistical efficiency and the ability to move massive tonnage through the African and Southeast Asian corridors with minimal friction. While margins per tonne are tighter than premium varieties, the sheer velocity of these contracts provides the operational cash flow that sustains major export houses.
Basmati Rice: The Premium Specialist Basmati rice represents the "high-margin" end of the barbell strategy, bringing in USD 5.94 Billion according to the APEDA Annual Report 2024-25. Unlike the volume-driven non-basmati trade, Basmati is a branded commodity. According to market analysis, the profitability is dictated by "vintage" and morphological specs—specifically aroma and grain elongation. Buyers in the UAE, Saudi Arabia, and Iraq are not purchasing calories; they are purchasing a luxury culinary experience. For the exporter, this means a "clean audit trail" and lab-verified purity are the primary tools for capturing a 15-25% price premium over standard long-grain rivals.
Indian Rice Export Market
| Product | Export Value | Key Markets |
|---|---|---|
| Non-Basmati Rice | 6.53B | Africa, SE Asia, Middle East |
| Basmati Rice | 5.94B | UAE, Saudi Arabia, Iraq, UK |
(Source: APEDA Annual Report 2024-25)
3.2 Spices: The Highest Margin Corridor
India's standing as the global leader in the spice trade is a matter of both tradition and modern technical dominance. According to the Spices Board Annual Report 2024-25, India has successfully scaled its operations to reach over 180+ countries , generating a massive USD 4,722.65 Million in export value. The real story, however, is the long-term momentum; the sector has witnessed a staggering +168% growth in INR terms over the last decade.
The profitability in this category isn't coming from bulk seeds. It is being driven by high-spec value addition. Moving from raw whole spices to sterilized powders, oils, and oleoresins allows exporters to capture the "technical premium" required by global food processors. According to market data, these processed extracts are essential for industrial consistency, allowing India to command margins that far exceed those of raw commodities.
Indian Spice Export Market Share
| Spice Category | Market Share | Strategic Leverage |
|---|---|---|
| Chilli | 28% | High-velocity volume and color consistency |
| Cumin | 16% | Global demand for essential oil content |
| Oleoresins | 11% | Highest Margin through technical processing |
| Mint | 9% | Industrial pharmaceutical and FMCG demand |
| Turmeric | 7% | High curcumin-spec premium pricing |
3.3 Processed Food: The High-Velocity Pivot
The most aggressive movement in the 2026 trade landscape is the decisive shift from raw commodity tonnage to value-added engineering. According to the APEDA Annual Report 2024-25, the processed food segment has executed a massive 36.72% growth surge, effectively capturing a ~20.4% share of India's total agri-export basket. This isn't just a volume play; it is a fundamental pursuit of higher margins through technical processing and industrial scalability.
For the exporter, the appeal of processed goods lies in their logistical resilience. According to trade analysis, shelf-stable formats eliminate the "ticking clock" of spoilage that historically erodes 20% of profit in fresh-market corridors. By transforming raw harvest into high-velocity ingredients, Indian firms are successfully bypassing the razor-thin margins and price volatility associated with raw staples.

High-Growth Processed Categories For Food Exports From India
| Category | Growth % | Strategic Driver |
|---|---|---|
| Cocoa Products | 61.02% | Surge in global confectionery & industrial demand |
| Pulses | 24.46% | Rise of plant-based protein & shelf-stable staples |
| Processed Vegetables | 13.94% | Demand for factory-line consistency & convenience |
3.4 Livestock & Animal Products: High-Value Protein Corridors
The livestock sector represents one of India's most resilient export engines and provides critical protein infrastructure to the Middle East and Southeast Asian markets. This segment is defined by high-value, high-velocity contracts that rely on strict technical compliance and cold-chain integrity.
Buffalo Meat: The Strategic Anchor Generating a massive USD 4,060.56 Million in export value, buffalo meat remains the dominant force in India's animal product portfolio. Profitability here is driven by its status as an essential, cost-effective industrial protein for factory-line processing and national food security in import-dependent regions. According to trade analysis, the sector's success is anchored in meeting the rigorous Halal certification and phytosanitary standards of the GCC, ensuring demand remains inelastic even during global market shifts.
Dairy & Honey: Technical Niches While lower in total volume, Dairy (USD 492.86 Million) and Honey (USD 206.47 Million) function as high-margin technical plays. According to the APEDA Annual Report 2024-25, the real commercial leverage in honey comes from "clean audit trails" and lab-verified purity, which allow Indian exporters to command 15-25% premiums in premium Western and Asian corridors. Similarly, dairy exports are pivoting toward value-added ingredients like Ghee and specialized powders, bypassing the low-margin volatility of raw milk.
Livestock Export Performance Matrix
| Product | Export Value | Primary Markets | Strategic Lever |
|---|---|---|---|
| Buffalo Meat | USD 4,060.56 Million | SE Asia, Middle East | Industrial Scale & Halal Compliance |
| Dairy Products | USD 492.86 Million | Middle East, Bhutan | Value-Added Processing |
| Natural Honey | USD 206.47 Million | USA, UAE | Lab-Verified Purity & Audit Trails |
3.5 Organic Products: The Premium Technical Segment
The organic corridor represents the elite end of the best food products to export from India , functioning as a high-margin niche that prioritizes "clean audit trails" over raw volume. According to the APEDA Annual Report 2024-25, India has generated a robust USD 665.97 Million in organic export value, reaching over 50+ countries . This segment is anchored by a massive production base of 2.2 million farmers , providing India with a unique supply advantage in a world increasingly obsessed with lab-verified purity.
Profitability in this sector is driven by a brutal focus on certification and technical specifications. In premium Western corridors, organic labels aren't just marketing—they are hard-line entry requirements that allow exporters to command 15-25% premiums above standard commodity baselines. According to trade analysis, the demand is particularly inelastic in developed markets where consumers treat organic certification as a non-negotiable insurance policy for health and quality.
For the trader in 2026, the organic segment is the ultimate "high-friction, high-reward" play. While the compliance hurdles are high, the logistical resilience of these products is superior; organic processed grains and spices often feature the extended shelf life necessary to eliminate the spoilage risks that kill 20% of profit in fresh-market corridors. By leveraging India's vast farmer network and tightening technical audit trails, exporters are successfully capturing the most aggressive revenue streams in the global premium market.
According to data from the APEDA Annual Report 2024-25, the dominance of these categories is a result of their industrial repeatability and their status as essential ingredients in global supply chains. Whether it is Marine Products topping the value chart or the dual-force of Basmati and Non-Basmati rice, the numbers confirm that India is the primary corridor for international buyers seeking reliability at scale.
4.0 India's Export Leaders: The Data-Driven Proof
India's export profitability is not theoretical—it is backed by strong commodity-level performance across global markets. The 2026 trade landscape reveals that a select group of top Indian export commodities effectively anchors the nation's multi-billion dollar revenue stream. These leaders aren't just high-volume fillers; they represent the successful execution of the "barbell strategy," where massive tonnage in staples like rice and meat funds the technical expansion into high-margin segments.
Top 10 Indian Export Commodities by Value
| Rank | Commodity | Export Value (USD Billion) | Strategic Lever |
|---|---|---|---|
| 1 | Marine Products | 7.41 | USA, EU, Japan, China |
| 2 | Non-Basmati Rice | 6.53 | Africa, SE Asia, Middle East |
| 3 | Basmati Rice | 5.94 | UAE, Saudi Arabia, Iraq, UK |
| 4 | Spices | 4.45 | China, USA, UAE, Bangladesh |
| 5 | Buffalo Meat | 4.06 | Vietnam, Egypt, Malaysia, Iraq |
| 6 | Sugar | 2.16 | Indonesia, Bangladesh, UAE, Somalia |
| 7 | Coffee | 1.81 | Italy, Germany, Russia, Belgium |
| 8 | Misc Processed Items | 1.68 | USA, UAE, Saudi Arabia, Netherlands |
| 9 | Tobacco Unmanufactured | 1.48 | Belgium, UAE, Indonesia, Philippines |
| 10 | Oil Meals | 1.34 | South Korea, Vietnam, Thailand, Indonesia |
Source: APEDA
This performance data reinforces the commercial reality: the most profitable Indian food products for export are those that hit the trifecta of extended shelf life, technical value-addition, and inelastic global demand. For the trader, these rankings are the roadmap for 2026—identifying exactly where the global capital is flowing and where the most resilient margins are being captured.
Conclusion:
The transition from a volume-based model to a technical, high-margin strategy is no longer optional for the 2026 trade cycle. As India cements its rank as a top-tier global supplier, the real yield is found in identifying high profit Indian food products for export that prioritize value-addition and "clean audit trails" over raw tonnage. Whether leveraging the premium status of aged Basmati or the industrial consistency of processed cocoa and spices, the objective remains the same: insulating the bottom line from commodity volatility. Success in this landscape belongs to those who view export not just as a shipping task, but as a high-spec technical execution.
Disclaimer
The information provided in this article is based on industry reports, APEDA data, and global trade estimates. Export values, demand trends, and profit margins may vary depending on market conditions, product specifications, and international regulations. Readers are advised to verify certifications, compliance requirements, and pricing before entering export markets.
Author Profile
Pravarsh Sharma - Trade Export Specialist, Tradologie.com
Pravarsh Sharma is a trade export specialist at Tradologie.com, actively involved in global B2B food trade and international market development. With hands-on experience in agro-commodity exports, compliance processes, and buyer sourcing, he provides practical insights into high-profit export opportunities and global trade strategies. His focus is on helping businesses scale efficiently in international markets.


")


.webp "Types of Rice in India’s Export Market: Complete Guide for Global Buyers")